The Rise of Wealth, Private Property, and Income Inequality in China
Analysis of a unique dataset provides a systematic estimate of the accumulation and distribution of China’s wealth and income between 1978 and 2015
INSIGHTS
Since 1978, China has transformed from a poor, relatively equal society to a leading global economy with levels of inequality surpassing much of Europe and resembling the U.S.
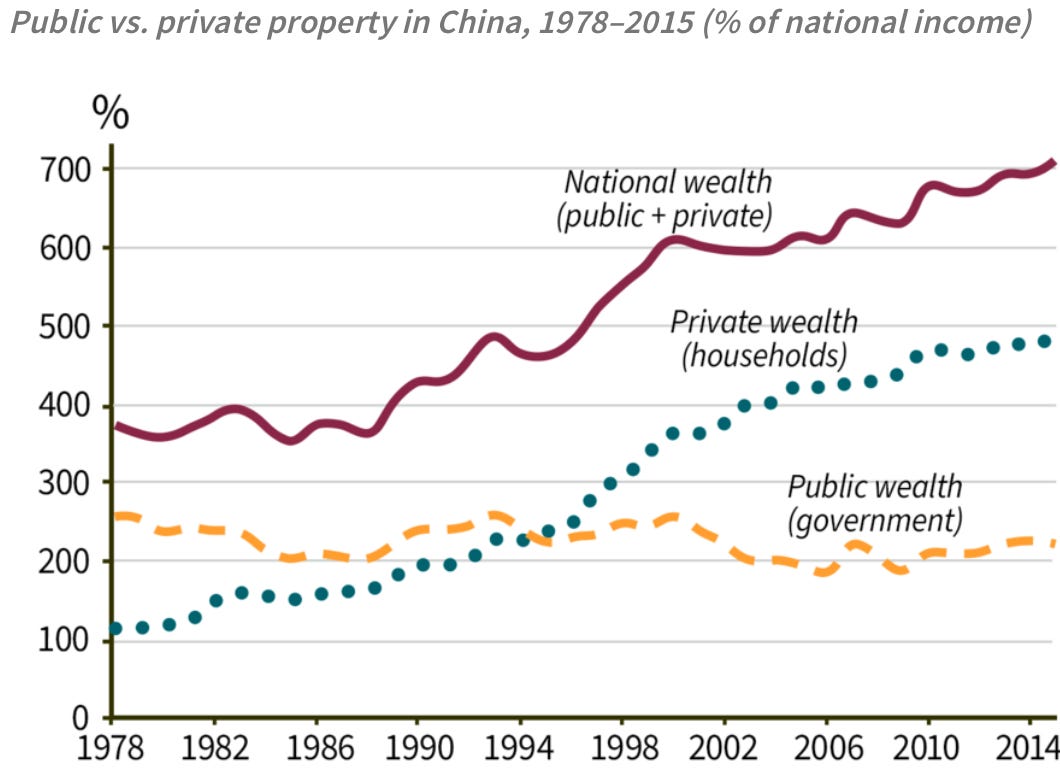
The state-owned (vs. privately-owned) share of China’s wealth fell from 70% to about 30%, compared to 0% in the U.S. (adjusted for debt).
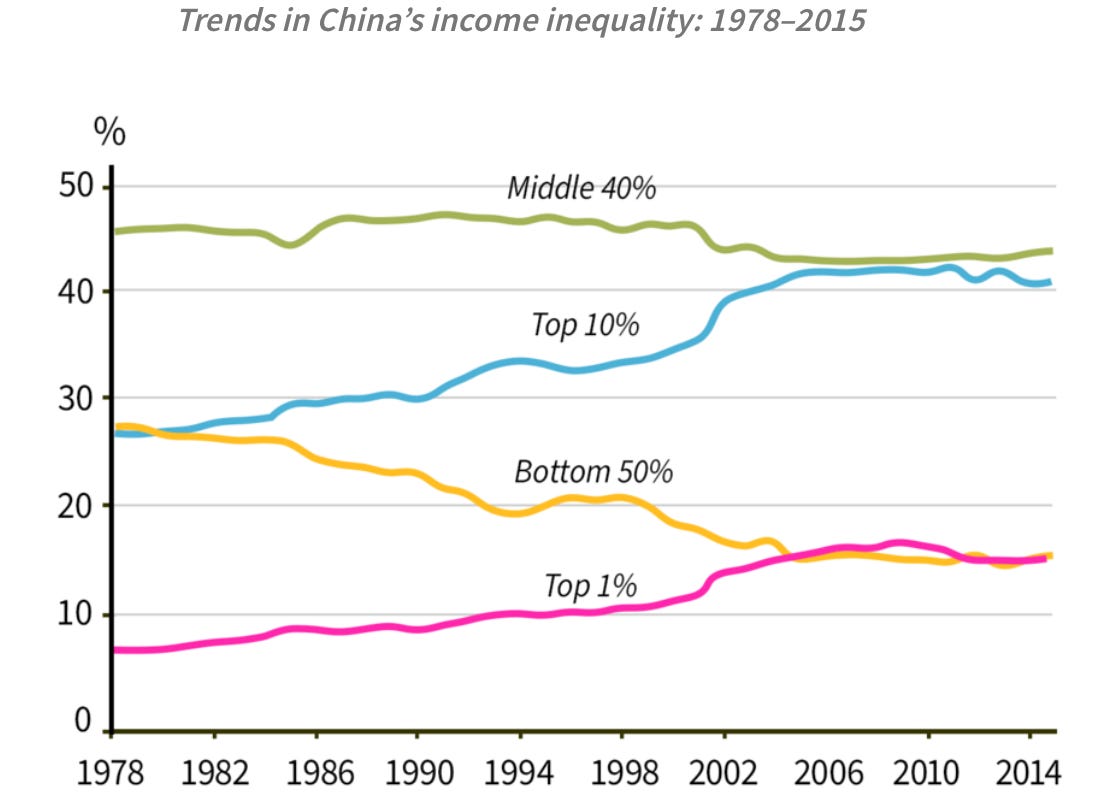
The share of China’s national income earned by the top 10% of the population has increased from 27% in 1978 to 41% in 2015, nearing the U.S.’s 45% and surpassing France's 32%.
Similarly, the wealth share of the top 10% of the population reached 67%, close to the U.S.’s 72% and higher than France’s 50%.
Meanwhile, income for China’s bottom 50% (539 million adults) increased fivefold since 1978, while the U.S. saw a 1% decrease.
Source Publication: Thomas Piketty, Li Yang, and Gabriel Zucman (2019). Capital Accumulation, Private Property, and Rising Inequality in China, 1978–2015. American Economic Review.
China’s share of world GDP increased from less than 3% in 1978 to 20% in 2015, while average income has increased by a factor of eight. How has the distribution of income and wealth within China changed over this critical period?
The data. This paper relies on five types of data sources: national income and wealth macro accounts, household income surveys, income tax data, household wealth surveys, and wealth rankings. China’s national wealth estimates were derived from Material Planning System’s national accounts, the China Statistical Yearbook, and Compendium of Statistics, supplemented with National Bureau of Statistics’ asset data and recent studies.
Income inequality was calculated from national household surveys by China’s Statistical Bureau, corrected for top income underestimations using tax administration data, and integrated with wealth and national account data for tax-exempt capital income. Wealth inequality was assessed using China Household Income Project and China Family Panel Study wealth surveys, integrated with annual Hurun rankings to account for China’s wealthiest households.
Major increases in national wealth and privatization. Researchers first measure China’s ratio of national wealth to national income — a snapshot of a country's wealth relative to its income that yields insight into a country’s economic structure and serves as a basis for comparison across countries. They found that between 1978 and 2015, China’s national wealth-income ratio sharply increased from 350% to 700%.
A notable feature in the evolution of China’s wealth over this period is the division of national wealth into private and public wealth. Privatization has been extensive: the share of public property in national wealth has declined from 70% in 1978 to 30% in 2015. More than 95% of the housing stock is now owned by private households relative to 50% in 1979. China’s corporations, however, are still predominantly publicly owned: close to 60% of China’s equities belong to the government, while 30% are private Chinese owners, and 10% belong to foreigners.
Researchers attribute the increase in China’s national wealth-income ratio to a combination of high savings rates (accounting for 50% to 60% of the rise) and a gradual rise in relative asset prices (accounting for 40% to 50% of the rise). Both reflect changes in the legal system of property that have reinforced property rights over assets like housing. While the share of public property in national wealth has declined to 0% or less in Western countries (with public debt exceeding public assets in the U.S., Britain, Japan, and Italy today), the public share in China has grown slightly since the 2008 financial crisis.
A sharp rise in income and wealth inequality. Researchers found that the share of China’s national income earned by the top 10% of the population has increased from 27% in 1978 to 41% in 2015, while the share earned by the bottom 50% (a group that includes 536 million adults) has dropped from 27% to 15%. Over the same period, the share of income going to the middle 40% has been roughly stable. The largest increase in inequality took place between the mid-1980s and the mid-2000s, and may have stabilized since then.
Wealth, however, is significantly more concentrated than income: the top 10% holds approximately 67% of China’s wealth compared with 41% for income. The top .001% owns 5.8% of China’s total wealth, which is roughly equivalent to that of the bottom 50%.
Income and wealth inequality approaching or exceeding levels in the U.S. and Europe. China’s inequality levels used to be lower than Europe’s in the late 1970s, close to the most egalitarian Nordic countries. Now, however, it is approaching U.S. levels. The bottom 50% earns about 15% of total income in China versus 12% in the U.S. and 22% in France. However, China’s top 10% wealth share (67% in 2015) is getting close to that of the U.S. (72%) and is much higher than in a country like France (50%).
Since 1978, average adult national income has grown by 8 times in China, albeit from a very low base. Beginning from a much higher base, average income has increased by 59% in the U.S. and by 39% in France. Average income for the top 0.001% has grown by more than 26 times in China since 1978, and by almost 8 times in the U.S.
The key difference between China and the U.S. since the 1970s is that in China, the bottom 50% has benefited enormously from growth. Its average income grew by 5 times in real terms, which is less than macro growth and top income growth, but still substantial. This increase presumably made rising inequality more acceptable, especially since living standards were very low in 1978. By contrast, income growth for the bottom 50% in the U.S. has been negative (–1%).
Taking stock of rising inequality in China. This study suggests that while China has moved a long way toward privatization between 1978 and 2015, the government still owns considerably more wealth than in most rich countries. Since the market reforms of the late 1970s, China has ceased to be communist, but is not entirely capitalist. Rather, researchers suggest that China should be viewed as a mixed economy with strong public ownership. While comparisons are difficult, the available evidence indicates that income growth trends in China during this period may have been more egalitarian than those of the U.S., but less so than Europe’s. However, the current lack of transparency about income and wealth data in China, especially regarding offshore assets, puts serious limits on researchers’ collective ability to monitor inequality dynamics and design adequate policy responses.


